Medication reference
Indications, doses, timing, adverse effects and interactions for ACM Extended medications, with unavailable legacy entries clearly marked.
Hardcore IV / IO pushes: the affected cards show the default time and link to slow and incremental pushing. A default time applies to the current target volume and is not a safe-dose limit. Native timing graphs describe medication after delivery; an incremental push spreads delivery across time.
Open printable medication chart
These cards describe game behavior. Vial pictures reproduce the mod’s artwork; use the written concentration on each card when a printed vial label differs. Dose gives the in game reference amount or fixed product action, with separate examples where needed. A reference dose is not a maximum dose, a whole vial, or a promise of a specific response. Weight based examples use the game’s 83 kg reference patient. Hover, tap or use the graph time control to inspect the curve. Readouts show the delivered reference dose and relative game effect, not a measured serum concentration. A hollow point marks an isolated boundary value in the native timing formula. Timings begin after medication reaches the patient; a closed line, required flush or poor IM absorption changes what you observe.
Find a medication
Medication cards
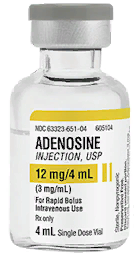
- Indications
- Regular SVT with a pulse.
- Contraindications
- Does not terminate AFib, atrial tachycardia, VT, VF, PEA or asystole. Avoid using it to treat a fast sinus rate.
- Route
- Dose
- 6 mg is the game reference dose (2 mL of the 3 mg/mL vial). With Hardcore Medications on, the default is 3 seconds; up to 5 seconds per 6 mg equivalent retains the full speed multiplier. Slower manual delivery weakens conversion only with that setting on.
- Onset
- AV-nodal slowing builds over about 1 second after the dose reaches the patient. The SVT conversion check occurs at about 1 second.
- Peak effect
- IV1 s
- IO1 s
- Side effects
- Brief slowing of the heart rate. The dedicated effect lasts less than 15 seconds. It does not deliberately create a flatline or cardiac arrest.
- Special considerations
- With Require saline flush after push enabled, complete the flush before judging the response. Hanging a slow adenosine infusion does not reproduce a rapid push.
- Medication interactions
- No separate drug pair conversion bonus is modeled. Other rate lowering drugs can still influence the patient's final heart rate.
| Route | 10% onset marker | Peak effect | Full effect hold | Effect ends |
|---|---|---|---|---|
| 0.06 s | 1 s | 1 s | 15 s |
Adenosine IV / IO effect graph
The percentage shows this route’s relative medication effect for one delivered dose. The 10% marker is a comparison point, not a guaranteed symptom onset. Sedation, paralysis, reversal and an ongoing infusion can follow additional rules described on the card.
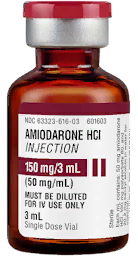
- Indications
- Improves defibrillation response in VF and pulseless VT. Rate controls AFib with RVR and can terminate atrial tachycardia or SVT; its reviewed perfusing conversion path does not directly convert VT.
- Contraindications
- Does not treat torsades. Avoid excessive cumulative dosing or a rapid infusion, especially when blood pressure is already low.
- Route
- Dose
- 150 mg reference dose (3 mL). For a controlled infusion, 150 mg over 10 minutes delivers 15 mg/min. Stock vial: 150 mg.
- Onset
- Builds after systemic delivery; the reference effect peaks at 10 seconds. Rhythm conversion can occur before the peak once enough effect is present.
- Peak effect
- IV10 s
- IO10 s
- Side effects
- Hypotension with excessive delivery rate; nausea. Large exposure can cause severe bradycardia, and cumulative exposure of 2.2 g or more can contribute to torsades.
- Special considerations
- Require saline flush after push applies when enabled. A 150 mg reference is a model amount, not a maximum cumulative dose or a guaranteed conversion.
- Medication interactions
- Esmolol adds further slowing and hypotension. Ondansetron can reduce medication related nausea. Hyaluronidase is the matching local treatment for an extravasation injury.
| Route | 10% onset marker | Peak effect | Full effect hold | Effect ends |
|---|---|---|---|---|
| 0.64 s | 10 s | 8 min | 12 min |
Amiodarone IV / IO effect graph
The percentage shows this route’s relative medication effect for one delivered dose. The 10% marker is a comparison point, not a guaranteed symptom onset. Sedation, paralysis, reversal and an ongoing infusion can follow additional rules described on the card.
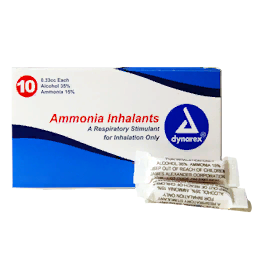
- Indications
- A wake-up attempt in a patient whose circulation and other vital signs are stable.
- Contraindications
- Unstable vital signs or another condition forcing unconsciousness prevent the wake-up effect. The action is unavailable while a provider is actively bagging.
- Route
- Inhaled at the head.
- Dose
- One inhalant use through the treatment action.
- Onset
- The wake-up check runs when the action completes. The short vital sign effect peaks at 3 seconds.
- Peak effect
- Inhaled3 s
- Side effects
- Transient increase in heart rate and breathing rate. No additional ammonia specific adverse syndrome is modeled in the reviewed path.
- Special considerations
- Repeated use within 10 seconds does not give another wake-up roll. Check the cause of unconsciousness before repeating it. Access is controlled by Allow Ammonia Inhalant.
- Medication interactions
- No specific interaction multiplier is modeled. It does not reverse opioids, sedatives or rocuronium.
| Route | 10% onset marker | Peak effect | Full effect hold | Effect ends |
|---|---|---|---|---|
Inhaled | 0.19 s | 3 s | 6 s | 40 s |
Ammonia inhalant Inhaled effect graph
The percentage shows this route’s relative medication effect for one delivered dose. The 10% marker is a comparison point, not a guaranteed symptom onset. Sedation, paralysis, reversal and an ongoing infusion can follow additional rules described on the card.
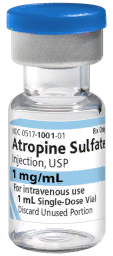
- Indications
- Raises heart rate; also treats the modeled effects of sarin exposure once sufficient active medication is present.
- Contraindications
- Avoid treating an already fast rhythm with a drug that raises rate. It does not directly terminate a tachyarrhythmia or provide ROSC.
- Route
- Dose
- Reference dose: 1 mg IV / IO or 2 mg IM. Sarin treatment depends on accumulated active effect, so one reference dose is not a complete toxin reversal.
- Onset
- Effect develops after delivery. IV / IO peaks at 5 seconds; IM peaks at 30 seconds. Chemical buildup reduction is gradual.
- Peak effect
- IV5 s
- IO5 s
- IM30 s
- Side effects
- Increased heart rate. Excess active medication can produce a larger than intended rate response.
- Special considerations
- CBRN treatment can also clear sarin related airway spasm at sufficient effect. Airway and ventilation support may still be needed.
- Medication interactions
- No dedicated interaction with esmolol or amiodarone is modeled; their rate effects still contribute to the final vital signs. Atropine and dimercaprol treat different chemical agents.
| Route | 10% onset marker | Peak effect | Full effect hold | Effect ends |
|---|---|---|---|---|
| 0.32 s | 5 s | 10 min | 15 min |
IM | 5.8 s | 30 s | 10 min | 15 min |
Atropine IV / IO effect graph
The percentage shows this route’s relative medication effect for one delivered dose. The 10% marker is a comparison point, not a guaranteed symptom onset. Sedation, paralysis, reversal and an ongoing infusion can follow additional rules described on the card.
Atropine IM effect graph
The percentage shows this route’s relative medication effect for one delivered dose. The 10% marker is a comparison point, not a guaranteed symptom onset. Sedation, paralysis, reversal and an ongoing infusion can follow additional rules described on the card.
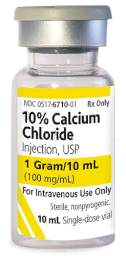
- Indications
- Calcium replacement during blood product resuscitation, impaired clotting and hypocalcemia. Helps correct a hypocalcemic cause of recurrent torsades.
- Contraindications
- Use cautiously when calcium is already adequate. Excessive amount or delivery rate can cause severe toxicity. It does not replace volume or magnesium for active torsades.
- Route
- Dose
- 1 g reference dose (10 mL of 100 mg/mL). This contains 273 mg of elemental calcium in the game's calcium calculation.
- Onset
- Admitted dose starts contributing to calcium replacement during delivery. The reference medication effect peaks at 5 minutes.
- Peak effect
- IV5 min
- IO5 min
- Side effects
- Extravasation injury. Excess calcium can first raise blood pressure, then cause bradycardia, low blood pressure and arrest as toxicity worsens.
- Special considerations
- Require saline flush after push applies when enabled. For transfusion replacement, 1 g over 5 min is a controlled game-model example. Begin early; reassess during continued transfusion. See timing for the first and fourth units and build/mode differences.
- Medication interactions
- Calcium gluconate adds to the same elemental calcium burden. Correcting low calcium improves responsiveness to epinephrine and norepinephrine. Hyaluronidase treats the local extravasation injury.
| Route | 10% onset marker | Peak effect | Full effect hold | Effect ends |
|---|---|---|---|---|
| 19.3 s | 5 min | 10 min | 45 min |
Calcium chloride IV / IO effect graph
The percentage shows this route’s relative medication effect for one delivered dose. The 10% marker is a comparison point, not a guaranteed symptom onset. Sedation, paralysis, reversal and an ongoing infusion can follow additional rules described on the card.
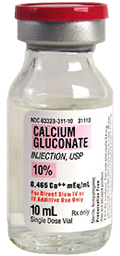
- Indications
- Calcium replacement during resuscitation and correction of hypocalcemia.
- Contraindications
- Excessive calcium amount or rate can cause toxicity. It is not interchangeable gram for gram with calcium chloride.
- Route
- Dose
- 3 g reference dose (30 mL of 100 mg/mL). This supplies 279 mg of elemental calcium in the game, close to 1 g of calcium chloride.
- Onset
- Calcium replacement follows admitted delivery; the reference medication effect peaks at 7 minutes.
- Peak effect
- IV7 min
- IO7 min
- Side effects
- Extravasation injury. Excess calcium can cause hypertension followed by bradycardia, hypotension and arrest.
- Special considerations
- Stock vial contains 5 g in 50 mL; the replacement reference is 3 g. At that dose, the 120 s Hardcore default exceeds the elemental fast-rate threshold; 300 s gives 55.8 mg/min instead. Flush when required. See dose and rate comparison and timing for the first and fourth units.
- Medication interactions
- Adds to calcium chloride's calcium burden. Correcting low calcium supports pressor responsiveness. Hyaluronidase is the matching local antidote for a leak.
| Route | 10% onset marker | Peak effect | Full effect hold | Effect ends |
|---|---|---|---|---|
| 27 s | 7 min | 10 min | 45 min |
Calcium gluconate IV / IO effect graph
The percentage shows this route’s relative medication effect for one delivered dose. The 10% marker is a comparison point, not a guaranteed symptom onset. Sedation, paralysis, reversal and an ongoing infusion can follow additional rules described on the card.
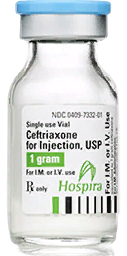
- Indications
- Antibiotic care. The current game assigns it the same antibiotic effect family as ertapenem.
- Contraindications
- No antibiotic specific contraindication is enforced in the reviewed medication path. It does not treat hemorrhage, airway obstruction or an abnormal rhythm.
- Route
can be added to a prepared saline infusion.
- Dose
- 1 g reference dose (10 mL of the 100 mg/mL vial).
- Onset
- Reference effect begins after delivery and peaks at 5 seconds IV / IO or 30 seconds IM.
- Peak effect
- IV5 s
- IO5 s
- IM30 s
- Side effects
- No additional ceftriaxone specific adverse syndrome is implemented in the reviewed medication path.
- Special considerations
- The short game timing is not a real world infection response time. The shared antibiotic model does not simulate a full organism specific treatment course.
- Medication interactions
- No dedicated drug pair interaction is modeled. Ceftriaxone and ertapenem share the antibiotic effect family; different labels do not create two independent mechanisms.
| Route | 10% onset marker | Peak effect | Full effect hold | Effect ends |
|---|---|---|---|---|
| 0.32 s | 5 s | 10 min | 15 min |
IM | 5.8 s | 30 s | 15 min | 20 min |
Ceftriaxone IV / IO effect graph
The percentage shows this route’s relative medication effect for one delivered dose. The 10% marker is a comparison point, not a guaranteed symptom onset. Sedation, paralysis, reversal and an ongoing infusion can follow additional rules described on the card.
Ceftriaxone IM effect graph
The percentage shows this route’s relative medication effect for one delivered dose. The 10% marker is a comparison point, not a guaranteed symptom onset. Sedation, paralysis, reversal and an ongoing infusion can follow additional rules described on the card.
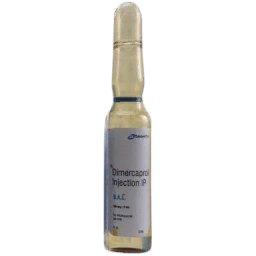
Do not plan treatment around this medication. Its artwork and legacy ACM reference are retained for identification only.
- Indications
- Not available for treatment in the current game. Legacy ACM data associates it with lewisite exposure.
- Contraindications
- Unavailable. Use the available chemical exposure and supportive care systems.
- Route
- Unavailable in the current game. Legacy record: IM.
- Dose
- No usable in-game dose. Legacy data contains a 3 mg/kg reference; this is not a current treatment instruction.
- Onset
- Legacy timing only. The reference below does not establish current availability.
- Peak effect
- IM30 s
- Side effects
- Increased heart rate; higher exposure can contribute to excessive vital sign effects.
- Special considerations
- The retained curve and artwork describe legacy data. Do not carry, mix or select dimercaprol as part of the current treatment plan.
- Medication interactions
- Legacy references distinguish lewisite from sarin. Dimercaprol is unavailable in the current game.
| Route | 10% onset marker | Peak effect | Full effect hold | Effect ends |
|---|---|---|---|---|
IM | 5.8 s | 30 s | 15 min | 30 min |
Legacy Dimercaprol curve: unavailable in game
Legacy reference only. Dimercaprol is not available in game.
The percentage shows this route’s relative medication effect for one delivered dose. The 10% marker is a comparison point, not a guaranteed symptom onset. Sedation, paralysis, reversal and an ongoing infusion can follow additional rules described on the card.
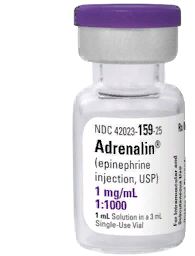
- Indications
- Measured push dose blood pressure support, pressor infusion and cardiac arrest medication support. The IM formulation has a separate vital sign effect.
- Contraindications
- Excessive rate or repeated dosing can cause tachycardia and a pressor surge. It does not correct blood loss; hypovolemia requires volume replacement.
- Route
permitted in prepared saline infusions. The dedicated Push Dose Epinephrine action is separate.
- Dose
- Reference: 1 mg IV / IO or 0.3 mg IM. These are not push dose amounts. The dedicated measured push dose action uses micrograms.
- Onset
- IV reference peak: 5 seconds. IM peak: 30 seconds. Infusion blood pressure support ramps in progressively and fades after stopping.
- Peak effect
- IV5 s
- IO5 s
- IM30 s
- Side effects
- Tachycardia, blood pressure overshoot, atrial tachycardia or SVT after a sustained surge, and vasopressor extravasation injury.
- Special considerations
- The regular vial is 1 mg/mL. The cardiac vial is ten times more dilute. Allow Push Dose Epinephrine Action and Dedicated Bolus Actions: Required Training govern the dedicated action.
- Medication interactions
- Low calcium and acidosis reduce pressor effectiveness. Other pressors add blood pressure support. Phentolamine treats local epinephrine extravasation. Sedatives may oppose its pressure effect without correcting the underlying shock.
| Route | 10% onset marker | Peak effect | Full effect hold | Effect ends |
|---|---|---|---|---|
| 0.32 s | 5 s | 3 min | 5 min |
IM | 5.8 s | 30 s | 4 min | 6 min |
Epinephrine IV / IO effect graph
The percentage shows this route’s relative medication effect for one delivered dose. The 10% marker is a comparison point, not a guaranteed symptom onset. Sedation, paralysis, reversal and an ongoing infusion can follow additional rules described on the card.
Epinephrine IM effect graph
The percentage shows this route’s relative medication effect for one delivered dose. The 10% marker is a comparison point, not a guaranteed symptom onset. Sedation, paralysis, reversal and an ongoing infusion can follow additional rules described on the card.
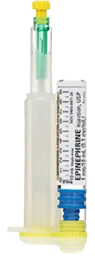
- Indications
- IV / IO cardiac arrest medication support and a dilute source for measured epinephrine mixtures.
- Contraindications
- A full cardiac vial contains 1 mg, which is much larger than a measured microgram push dose. Native administration is IV / IO only.
- Route
- Dose
- 1 mg in the full 10 mL vial. For a 10 mcg/mL mixture: 1 mL of this vial plus 9 mL saline makes 10 mL containing 100 mcg total.
- Onset
- Reference medication peak: 5 seconds after systemic delivery. A queued push starts acting after its required flush.
- Peak effect
- IV5 s
- IO5 s
- Side effects
- Same epinephrine adverse effects: excessive rate, pressure overshoot, atrial tachycardia or SVT and local tissue injury if it leaks.
- Special considerations
- Read the concentration on the vial before drawing. Require saline flush after push applies when enabled.
- Medication interactions
- Shares the same effects and cumulative exposure as regular epinephrine. Low calcium/acidosis blunt pressor support; phentolamine treats matching extravasation.
| Route | 10% onset marker | Peak effect | Full effect hold | Effect ends |
|---|---|---|---|---|
| 0.32 s | 5 s | 3 min | 5 min |
Epinephrine (cardiac vial) IV / IO effect graph
The percentage shows this route’s relative medication effect for one delivered dose. The 10% marker is a comparison point, not a guaranteed symptom onset. Sedation, paralysis, reversal and an ongoing infusion can follow additional rules described on the card.
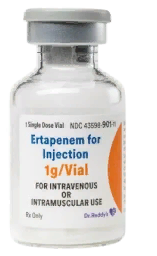
- Indications
- Antibiotic care through the game's antibiotic effect family.
- Contraindications
- No antibiotic specific contraindication is enforced in the reviewed medication path. It does not correct hemorrhage, hypoxia or an abnormal rhythm.
- Route
- Dose
- 1 g reference dose.
- Onset
- Reference peak: 5 seconds IV / IO or 30 seconds IM after delivery.
- Peak effect
- IV5 s
- IO5 s
- IM30 s
- Side effects
- No additional ertapenem specific adverse syndrome is implemented in the reviewed medication path.
- Special considerations
- The game timing describes a medication effect, not the time needed to cure an infection. It is not on the prepared saline addition list.
- Medication interactions
- Ceftriaxone shares this antibiotic effect family. No separate antibiotic interaction or compatibility reaction is modeled.
| Route | 10% onset marker | Peak effect | Full effect hold | Effect ends |
|---|---|---|---|---|
| 0.32 s | 5 s | 10 min | 15 min |
IM | 5.8 s | 30 s | 15 min | 20 min |
Ertapenem IV / IO effect graph
The percentage shows this route’s relative medication effect for one delivered dose. The 10% marker is a comparison point, not a guaranteed symptom onset. Sedation, paralysis, reversal and an ongoing infusion can follow additional rules described on the card.
Ertapenem IM effect graph
The percentage shows this route’s relative medication effect for one delivered dose. The 10% marker is a comparison point, not a guaranteed symptom onset. Sedation, paralysis, reversal and an ongoing infusion can follow additional rules described on the card.
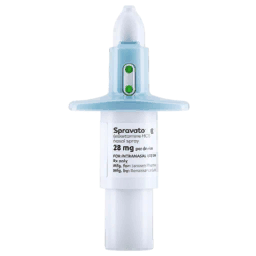
- Indications
- Intranasal analgesia when vascular access is unavailable; contributes to the shared sedation effect when other hypnotics are present.
- Contraindications
- Do not expect one atomizer to produce IV style induction. The action is unavailable while a provider is actively bagging.
- Route
- Intranasal.
- Dose
- One 50 mg atomizer is one fixed product dose in the game.
- Onset
- Absorption builds gradually; reference peak is 10 minutes. The graph's onset marker is not a guarantee of noticeable pain relief.
- Peak effect
- Intranasal10 min
- Side effects
- Nausea. Ketamine family exposure can raise heart rate/pressure when physiological reserve is adequate; severe shock can change that response. Excess combined exposure can depress breathing.
- Special considerations
- The product remains a fixed nasal dose; do not substitute its dose count for milligrams in a syringe calculation.
- Medication interactions
- Adds to ketamine family exposure. Opioids and midazolam increase respiratory depression risk and can increase the combined sedation effect. Ondansetron can reduce nausea.
| Route | 10% onset marker | Peak effect | Full effect hold | Effect ends |
|---|---|---|---|---|
Intranasal | 38.6 s | 10 min | 10 min | 60 min |
Esketamine Intranasal effect graph
The percentage shows this route’s relative medication effect for one delivered dose. The 10% marker is a comparison point, not a guaranteed symptom onset. Sedation, paralysis, reversal and an ongoing infusion can follow additional rules described on the card.
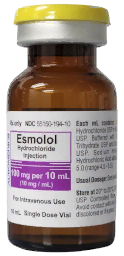
- Indications
- Rate controls AFib with RVR; can terminate atrial tachycardia or SVT. Also slows sinus heart rate.
- Contraindications
- Avoid in an already slow or poorly perfusing patient. It does not replace defibrillation for VF, pulseless VT or torsades.
- Route
Available as a vial and a premixed infusion.
- Dose
- 0.5 mg/kg reference dose, equivalent to 41.5 mg at 83 kg. Premixed bag contains 2.5 g in 250 mL; bag contents are not a single bolus dose.
- Onset
- Reference peak: 20 seconds. Rate control occurs once enough delivered medication has taken effect, not simply when the bag is connected.
- Peak effect
- IV20 s
- IO20 s
- Side effects
- Excess exposure can cause marked bradycardia and hypotension. An extravasated infusion can injure the site.
- Special considerations
- A controlled AFib response remains AFib, usually near a 90 BPM target. Effect continues to wash out after the infusion is stopped.
- Medication interactions
- Amiodarone adds further slowing and hypotension. Esmolol reduces lidocaine clearance, increasing toxicity risk. Hyaluronidase treats matching extravasation.
| Route | 10% onset marker | Peak effect | Full effect hold | Effect ends |
|---|---|---|---|---|
| 1.3 s | 20 s | 4 min | 5 min 20 s |
Esmolol IV / IO effect graph
The percentage shows this route’s relative medication effect for one delivered dose. The 10% marker is a comparison point, not a guaranteed symptom onset. Sedation, paralysis, reversal and an ongoing infusion can follow additional rules described on the card.
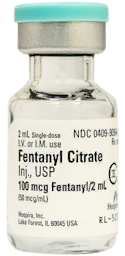
- Indications
- Analgesia; an adjunct to an actual sedative during procedures.
- Contraindications
- Use cautiously with depressed breathing, low pressure or other sedatives. It does not provide reliable hypnosis on its own.
- Route
permitted in prepared saline infusions.
- Dose
- 1 mcg/kg reference dose, equivalent to 83 mcg at 83 kg. Vial concentration: 50 mcg/mL; full vial: 500 mcg in 10 mL.
- Onset
- Reference peak: 10 seconds IV / IO or 30 seconds IM.
- Peak effect
- IV10 s
- IO10 s
- IM30 s
- Side effects
- Respiratory depression, reduced response to rising CO2, lower heart rate, nausea and opioid overdose with excessive exposure.
- Special considerations
- Injected fentanyl and the buccal lozenge have different timing and product units. Continue checking ventilation during pain relief.
- Medication interactions
- Morphine and the fentanyl lozenge add to opioid burden. Propofol or midazolam add respiratory depression, hypotension and hypnosis; ketamine adds a smaller respiratory interaction. Naloxone reverses opioid effects; ondansetron reduces nausea.
| Route | 10% onset marker | Peak effect | Full effect hold | Effect ends |
|---|---|---|---|---|
| 0.64 s | 10 s | 14 min | 16 min |
IM | 5.8 s | 30 s | 15 min | 20 min |
Fentanyl IV / IO effect graph
The percentage shows this route’s relative medication effect for one delivered dose. The 10% marker is a comparison point, not a guaranteed symptom onset. Sedation, paralysis, reversal and an ongoing infusion can follow additional rules described on the card.
Fentanyl IM effect graph
The percentage shows this route’s relative medication effect for one delivered dose. The 10% marker is a comparison point, not a guaranteed symptom onset. Sedation, paralysis, reversal and an ongoing infusion can follow additional rules described on the card.
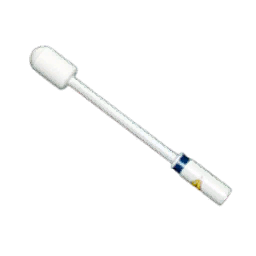
- Indications
- Buccal analgesia in an awake patient who is sitting or lying down.
- Contraindications
- Unavailable during active bagging, when another lozenge is present, or when the patient is not awake/in the required position. Use cautiously if ventilation is already poor.
- Route
- Buccal.
- Dose
- One lozenge through Give Fentanyl Lozenge. Uses fixed product dosing rather than injectable vial units.
- Onset
- Reference peak: 90 seconds. The lozenge remains in place for up to 180 seconds unless removed earlier.
- Peak effect
- Buccal1 min 30 s
- Side effects
- Opioid respiratory depression, nausea and excess combined opioid burden.
- Special considerations
- Remove Fentanyl Lozenge stops further use. Loss of consciousness, leaving the sitting/lying position or early removal changes the remaining effect; it does not erase the already absorbed dose.
- Medication interactions
- Shares opioid burden with injected fentanyl and morphine. Sedatives increase respiratory depression. Naloxone reverses opioid effects; ondansetron reduces nausea.
| Route | 10% onset marker | Peak effect | Full effect hold | Effect ends |
|---|---|---|---|---|
Buccal | 1 min 5.8 s | 1 min 30 s | 10 min | 15 min |
Fentanyl lozenge Buccal effect graph
The percentage shows this route’s relative medication effect for one delivered dose. The 10% marker is a comparison point, not a guaranteed symptom onset. Sedation, paralysis, reversal and an ongoing infusion can follow additional rules described on the card.
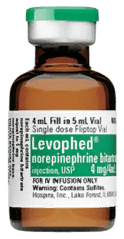 Shared mod icon. Read the card name and dose; the printed vial label belongs to norepinephrine.
- Indications
- Local treatment of extravasation from calcium, amiodarone, magnesium, esmolol, hypertonic saline or mannitol.
- Contraindications
- Does not treat epinephrine/norepinephrine extravasation. Injecting systemically does not substitute for the local infiltration treatment.
- Route
- Local infiltration at the affected body part.
- Dose
- 150 units is a full reference infiltration (1 mL). Smaller infiltrations can add together within the 90-second treatment window.
- Onset
- Recovery support starts when a matching local infiltration is completed. Tissue healing remains gradual.
- Peak effect
- Local recovery treatment; no fixed systemic peak.
- Side effects
- No separate systemic adverse syndrome is modeled for the local action. Choosing the wrong antidote leaves the injury untreated.
- Special considerations
- Each infiltration treats one matching exposure, prioritizing the most advanced injury and then the most recent exposure. Check the line and stop further leakage.
- Medication interactions
- Matches the listed irritant drugs. Phentolamine is the other local antidote and treats vasopressor leaks instead.
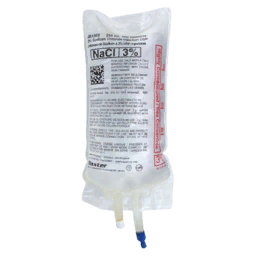
- Indications
- Osmotherapy for raised ICP in a patient with modeled TBI.
- Contraindications
- No useful ICP reduction when pressure is already at its treatment floor. Further osmotherapy is blocked at the Sodium ceiling, including mannitol in the current shared treatment check.
- Route
- Dose
- 250 mL is the osmotherapy reference amount. A full bag contains 7.5 g of sodium chloride.
- Onset
- Acts progressively as fluid reaches the patient. There is no separate fixed peak time for a whole infusion.
- Peak effect
- Depends on the amount and rate delivered.
- Side effects
- Increases the modeled sodium level. Extravasation can damage the access site.
- Special considerations
- Rate and delivered volume determine the response. The 23.4% bullet is a separate product and action, described below. Sodium ceiling (mEq/L) is under ACM Extended: Neuro & TBI.
- Medication interactions
- Mannitol shares the osmotherapy limit. Positioning and circulation support can also change ICP/CPP. Hyaluronidase treats matching extravasation.
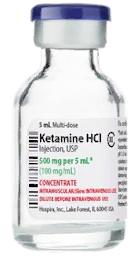
- Indications
- Analgesia at smaller doses and dose dependent sedation for procedures or intubation.
- Contraindications
- Severe hypovolemia/acidosis can reduce its usual blood pressure support. Large doses and sedative combinations can depress breathing. Hardcore Medications also adds a temporary rapid IV / IO push effect.
- Route
permitted in prepared saline infusions.
- Dose
- Analgesia reference: 0.2 mg/kg IV / IO or 0.75 mg/kg IM. At the default induction threshold, ketamine alone reaches the AI induction level at about 1.75 mg/kg IV or 4.375 mg/kg IM at full effect. The current IM calibration uses less hypnotic effect per dose than earlier versions.
- Onset
- Reference peak: 5 seconds IV / IO or 20 seconds IM. Sedation begins only when the combined active dose crosses the induction threshold.
- Peak effect
- IV5 s
- IO5 s
- IM20 s
- Side effects
- Nausea; dose dependent heart rate and pressure changes. High exposure can depress breathing, and overdose can cause severe respiratory depression. Hardcore Medications adds a separate temporary rapid-push load.
- Special considerations
Ketamine sedation and nystagmus tips are in Ventilator Settings & Tips.
Ketamine: induction threshold and Ketamine: maintenance threshold are under ACM Extended: Airway. Ketamine continues to use its detailed effect model even when ACE uses basic medication behavior.- Medication interactions
- Propofol and midazolam add to hypnosis. Fentanyl/morphine augment sedation and respiratory depression; midazolam adds another respiratory interaction. Rocuronium adds paralysis without adding sedation. Ondansetron reduces nausea.
| Route | 10% onset marker | Peak effect | Full effect hold | Effect ends |
|---|---|---|---|---|
| 0.32 s | 5 s | 9 min | 11 min |
IM | 0 s | 20 s | 10 min | 15 min |
Ketamine IV / IO effect graph
The percentage shows this route’s relative medication effect for one delivered dose. The 10% marker is a comparison point, not a guaranteed symptom onset. Sedation, paralysis, reversal and an ongoing infusion can follow additional rules described on the card.
Ketamine IM effect graph
The percentage shows this route’s relative medication effect for one delivered dose. The 10% marker is a comparison point, not a guaranteed symptom onset. Sedation, paralysis, reversal and an ongoing infusion can follow additional rules described on the card.
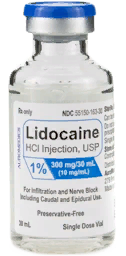
- Indications
- IV / IO antiarrhythmic support for VT with a pulse, and improved defibrillation response in VF or pulseless VT. The separate local/IM class provides anesthetic effects.
- Contraindications
- Does not treat torsades through the IV antiarrhythmic path. Avoid accumulating excessive exposure, especially in shock or with esmolol.
- Route
IM/local medication route for the separate anesthetic class. Permitted in saline infusions.
- Dose
- IV / IO reference: 1 mg/kg (83 mg at 83 kg). Separate IM/local reference: 100 mg.
- Onset
- IV / IO reference peak: 5 seconds; IM/local peak: 10 seconds. VT conversion uses current active IV effect.
- Peak effect
- IV5 s
- IO5 s
- IM10 s
- Side effects
- Nausea. Toxic accumulation can cause seizures/apnea, then bradycardia, hypotension and asystolic arrest.
- Special considerations
- Stop an excessive infusion and support ventilation. Midazolam can suppress the modeled toxicity seizure, but does not remove the lidocaine burden. Antiarrhythmic protection fades with current drug effect.
- Medication interactions
- Esmolol and shock reduce lidocaine clearance. Midazolam controls seizures with an effect requirement that rises as toxicity worsens. Ondansetron can reduce nausea.
| Route | 10% onset marker | Peak effect | Full effect hold | Effect ends |
|---|---|---|---|---|
| 0.32 s | 5 s | 6 min | 10 min |
IM | 0 s | 10 s | 4 min | 10 min |
Lidocaine IV / IO effect graph
The percentage shows this route’s relative medication effect for one delivered dose. The 10% marker is a comparison point, not a guaranteed symptom onset. Sedation, paralysis, reversal and an ongoing infusion can follow additional rules described on the card.
Lidocaine IM effect graph
The percentage shows this route’s relative medication effect for one delivered dose. The 10% marker is a comparison point, not a guaranteed symptom onset. Sedation, paralysis, reversal and an ongoing infusion can follow additional rules described on the card.
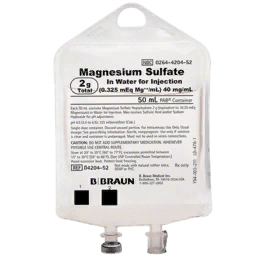
- Indications
- Terminates modeled torsades once sufficient effect develops and suppresses recurrence while enough effect remains.
- Contraindications
- Excessively rapid delivery can cause bradycardia and hypotension. It is not a general conversion drug for every wide complex rhythm.
- Route
- Dose
- 2 g reference dose, supplied in 50 mL.
- Onset
- Reference peak: 90 seconds. For one fully delivered reference dose, modeled termination effect is reached at about 21 seconds and suppression at about 15 seconds; a running infusion takes longer.
- Peak effect
- IV1 min 30 s
- IO1 min 30 s
- Side effects
- Bradycardia and hypotension at excessive delivery rates; local injury with extravasation.
- Special considerations
- Magnesium conversion still requires ROSC eligibility. Correct hypocalcemia or raised ICP if either is causing recurrence. Suppression follows active effect and is not a guaranteed five minute timer.
- Medication interactions
- Amiodarone accumulation can contribute to torsades and is not a substitute treatment. Calcium corrects a hypocalcemic cause. Hyaluronidase treats matching extravasation.
| Route | 10% onset marker | Peak effect | Full effect hold | Effect ends |
|---|---|---|---|---|
| 5.8 s | 1 min 30 s | 15 min | 30 min |
Magnesium sulfate IV / IO effect graph
The percentage shows this route’s relative medication effect for one delivered dose. The 10% marker is a comparison point, not a guaranteed symptom onset. Sedation, paralysis, reversal and an ongoing infusion can follow additional rules described on the card.
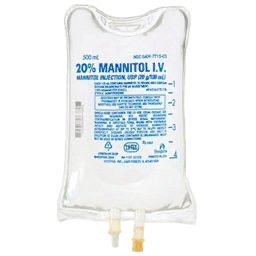
- Indications
- Osmotherapy for raised ICP in modeled TBI.
- Contraindications
- Use cautiously in a volume depleted patient. No additional ICP reduction below the treatment floor; the shared Sodium ceiling check can block it.
- Route
separate Push Mannitol 20% action.
- Dose
- Infusion reference: 500 mL of 20% solution (100 g). The separate push item is labeled 50 g; its current action supplies a smaller fixed treatment effect.
- Onset
- Infusion effect follows admitted volume. The dedicated push applies its effect when the treatment action completes.
- Peak effect
- Infusion: delivery dependent. Dedicated push: effect applied at completion.
- Side effects
- The item warns of diuresis and low volume. The dedicated push currently applies an ICP/sodium effect without directly removing circulating volume. Extravasation from an infusion can injure the site.
- Special considerations
- Allow Osmotherapy Bolus Actions and Dedicated Bolus Actions: Required Training control the dedicated push. The push and the full infusion bag do not deliver the same modeled ICP reduction.
- Medication interactions
- Shares the osmotherapy ceiling check with hypertonic saline. Hyaluronidase treats matching extravasation. Maintain adequate circulation while treating ICP.
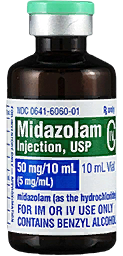
- Indications
- Sedation and contribution to the combined hypnosis effect. Suppresses modeled lidocaine toxicity seizures.
- Contraindications
- Use cautiously with low pressure or depressed breathing. It provides no analgesia by itself, and IM onset is slow in this build.
- Route
permitted in prepared saline infusions.
- Dose
- Reference dose: 5 mg IV / IO or 10 mg IM. The dose needed for a toxicity seizure increases as lidocaine burden rises.
- Onset
- Reference peak: 4 minutes IV / IO or 15 minutes IM. A useful effect can begin earlier as the dose absorbs.
- Peak effect
- IV4 min
- IO4 min
- IM15 min
- Side effects
- Respiratory depression, hypotension and reduced heart rate. Sedative stacking can cause deeper than expected hypnosis.
- Special considerations
- Reassess the current effect before repeating a slow IM dose. Ketamine: maintenance threshold also governs the shared maintenance sedation requirement.
- Medication interactions
- Opioids add respiratory depression, hypotension and hypnosis. Propofol adds further respiratory/pressure effects and hypnosis synergy. Ketamine adds a smaller respiratory interaction. Suppresses lidocaine related seizures without clearing lidocaine.
| Route | 10% onset marker | Peak effect | Full effect hold | Effect ends |
|---|---|---|---|---|
| 15.4 s | 4 min | 10 min | 45 min |
IM | 14 min 35.8 s | 15 min | 15 min | 60 min |
Midazolam IV / IO effect graph
The percentage shows this route’s relative medication effect for one delivered dose. The 10% marker is a comparison point, not a guaranteed symptom onset. Sedation, paralysis, reversal and an ongoing infusion can follow additional rules described on the card.
Midazolam IM effect graph
The percentage shows this route’s relative medication effect for one delivered dose. The 10% marker is a comparison point, not a guaranteed symptom onset. Sedation, paralysis, reversal and an ongoing infusion can follow additional rules described on the card.
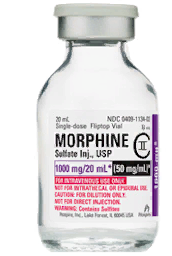
- Indications
- Analgesia and an adjunct to a true sedative.
- Contraindications
- Use cautiously with poor ventilation, hypovolemia or low pressure. It does not independently provide reliable hypnosis.
- Route
permitted in prepared saline infusions.
- Dose
- 0.1 mg/kg reference dose, equivalent to 8.3 mg at 83 kg. Stock concentration: 5 mg/mL.
- Onset
- Reference peak: 25 seconds IV / IO or 100 seconds IM.
- Peak effect
- IV25 s
- IO25 s
- IM1 min 40 s
- Side effects
- Respiratory depression, reduced CO2 responsiveness, lower heart rate, nausea and opioid overdose with excess exposure.
- Special considerations
- IM effect is reduced by poor perfusion. Follow breathing and oxygenation as well as the pain response.
- Medication interactions
- Fentanyl and fentanyl lozenges add to opioid burden. Propofol/midazolam add respiratory depression, hypotension and hypnosis; ketamine adds a smaller respiratory interaction. Naloxone reverses opioid effects; ondansetron reduces nausea.
| Route | 10% onset marker | Peak effect | Full effect hold | Effect ends |
|---|---|---|---|---|
| 1.6 s | 25 s | 15 min | 21 min 40 s |
IM | 1 min 15.8 s | 1 min 40 s | 20 min | 30 min |
Morphine IV / IO effect graph
The percentage shows this route’s relative medication effect for one delivered dose. The 10% marker is a comparison point, not a guaranteed symptom onset. Sedation, paralysis, reversal and an ongoing infusion can follow additional rules described on the card.
Morphine IM effect graph
The percentage shows this route’s relative medication effect for one delivered dose. The 10% marker is a comparison point, not a guaranteed symptom onset. Sedation, paralysis, reversal and an ongoing infusion can follow additional rules described on the card.
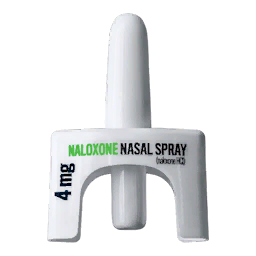
- Indications
- Reversal of opioid effects and the modeled opioid overdose syndrome.
- Contraindications
- Does not reverse ketamine, propofol, midazolam or rocuronium. The nasal action is unavailable while a provider is actively bagging.
- Route
- Intranasal.
- Dose
- One 4 mg/0.1 mL nasal spray through the treatment action.
- Onset
- Opioid reversal begins when administration completes. The separate reference effect peaks at 3 seconds; that curve does not describe a delay before reversal.
- Peak effect
- Intranasal3 s
- Side effects
- Loss of opioid analgesia can expose the patient's underlying pain. No separate withdrawal syndrome is modeled in the reviewed treatment.
- Special considerations
- Support inadequate breathing and reassess after administration. A new opioid dose is a new exposure and can cause renewed effects.
- Medication interactions
- Reverses morphine, fentanyl and buccal fentanyl effects. It does not remove the respiratory effects of non-opioid sedatives or reverse paralysis.
| Route | 10% onset marker | Peak effect | Full effect hold | Effect ends |
|---|---|---|---|---|
Intranasal | 0.19 s | 3 s | 2 min | 6 min |
Naloxone Intranasal effect graph
The percentage shows this route’s relative medication effect for one delivered dose. The 10% marker is a comparison point, not a guaranteed symptom onset. Sedation, paralysis, reversal and an ongoing infusion can follow additional rules described on the card.
- Indications
- Titrated blood pressure support, including support of cerebral perfusion when pressure is inadequate.
- Contraindications
- Does not replace lost blood. Use cautiously with pressure overshoot or a failing IV site.
- Route
permitted in prepared saline infusions.
- Dose
- Native effect reference: 80 mcg. Preparing 4 mg from the 1 mg/mL vial adds 4 mL to 250 mL saline, making 254 mL at about 15.75 mcg/mL. At 30 gtt/min on a 60 gtt/mL set, that delivers about 7.87 mcg/min before flow losses. This is a preparation example, not a 4 mg patient dose.
- Onset
- Reference medication peak: 30 seconds. Infusion blood pressure support ramps in over time and fades progressively after stopping.
- Peak effect
- IV30 s
- IO30 s
- Side effects
- Pressure overshoot and local vasopressor tissue injury with extravasation. Excess combined pressor support can worsen the patient's physiology.
- Special considerations
- Adjust the clamp using the actual mixture concentration and reassess pressure, perfusion and volume. Pressor response (mmHg per mcg/min) controls potency under ACM Extended: Neuro & TBI.
- Medication interactions
- Low calcium and acidosis blunt pressor response. Epinephrine adds pressure support but has its own stronger rate/surge effects. Phentolamine treats matching extravasation.
| Route | 10% onset marker | Peak effect | Full effect hold | Effect ends |
|---|---|---|---|---|
| 1.9 s | 30 s | 4 min | 6 min |
Norepinephrine IV / IO effect graph
The percentage shows this route’s relative medication effect for one delivered dose. The 10% marker is a comparison point, not a guaranteed symptom onset. Sedation, paralysis, reversal and an ongoing infusion can follow additional rules described on the card.
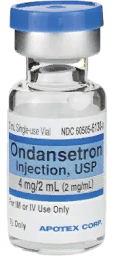
- Indications
- Reduction of medication related nausea, including nausea from opioids, ketamine, amiodarone and lidocaine.
- Contraindications
- Repeated excessive dosing does not keep improving nausea suppression; the game reduces suppression at high active exposure.
- Route
permitted in prepared saline infusions.
- Dose
- 4 mg reference dose (2 mL of 2 mg/mL).
- Onset
- Reference peak: 15 seconds IV / IO or 45 seconds IM.
- Peak effect
- IV15 s
- IO15 s
- IM45 s
- Side effects
- Small negative heart rate adjustment. The reviewed interaction path does not add a separate ondansetron induced QT/torsades mechanism.
- Special considerations
- Antiemetic treatment does not remove an airway obstruction, aspiration risk or the effects of a toxic medication dose.
- Medication interactions
- Reduces nausea from the listed drugs. It does not reverse their respiratory, hemodynamic or sedative effects.
| Route | 10% onset marker | Peak effect | Full effect hold | Effect ends |
|---|---|---|---|---|
| 0.97 s | 15 s | 10 min | 12 min |
IM | 20.8 s | 45 s | 12 min | 15 min |
Ondansetron IV / IO effect graph
The percentage shows this route’s relative medication effect for one delivered dose. The 10% marker is a comparison point, not a guaranteed symptom onset. Sedation, paralysis, reversal and an ongoing infusion can follow additional rules described on the card.
Ondansetron IM effect graph
The percentage shows this route’s relative medication effect for one delivered dose. The 10% marker is a comparison point, not a guaranteed symptom onset. Sedation, paralysis, reversal and an ongoing infusion can follow additional rules described on the card.
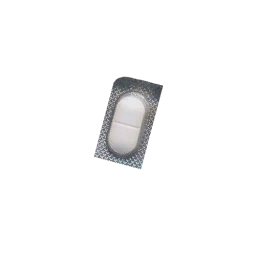
- Indications
- Milder pain where an oral product is suitable. Also labeled Acetaminophen in the inventory.
- Contraindications
- Requires an awake patient and is unavailable while a provider is actively bagging.
- Route
- Oral.
- Dose
- One available pack/tablet treatment use. The current effect calculation uses fixed product units rather than an injectable milligram reference.
- Onset
- Reference peak: 4 minutes after administration.
- Peak effect
- Oral4 min
- Side effects
- No additional paracetamol specific overdose syndrome is modeled in the reviewed medication path.
- Special considerations
- Oral analgesia does not replace treatment of the injury. Product pack labels and the fixed dose game effect are separate.
- Medication interactions
- No dedicated drug pair interaction is modeled. Analgesia still combines with other pain relief through the game's pain system.
| Route | 10% onset marker | Peak effect | Full effect hold | Effect ends |
|---|---|---|---|---|
Oral | 15.4 s | 4 min | 15 min | 50 min |
Paracetamol Oral effect graph
The percentage shows this route’s relative medication effect for one delivered dose. The 10% marker is a comparison point, not a guaranteed symptom onset. Sedation, paralysis, reversal and an ongoing infusion can follow additional rules described on the card.
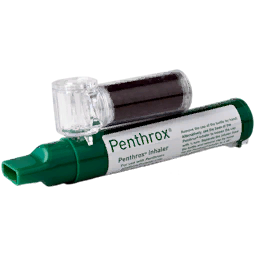
- Indications
- Inhaled analgesia for an awake patient.
- Contraindications
- Requires an awake patient and is unavailable during active bagging. Use cautiously when breathing is already depressed.
- Route
- Inhaled.
- Dose
- One inhaler use through the treatment action.
- Onset
- Reference peak: 3 seconds; short full effect period and a 4-minute medication lifetime.
- Peak effect
- Inhaled3 s
- Side effects
- Reduced breathing effectiveness, small heart rate reduction, and severe respiratory depression in the modeled overdose syndrome.
- Special considerations
- Repeat uses add exposure. Reassess ventilation during use even when the pain response is satisfactory.
- Medication interactions
- No dedicated Penthrox drug pair multiplier is modeled. Other respiratory depressants can still reduce the same vital signs. Naloxone does not reverse Penthrox.
| Route | 10% onset marker | Peak effect | Full effect hold | Effect ends |
|---|---|---|---|---|
Inhaled | 0.19 s | 3 s | 1 min 30 s | 4 min |
Penthrox Inhaled effect graph
The percentage shows this route’s relative medication effect for one delivered dose. The 10% marker is a comparison point, not a guaranteed symptom onset. Sedation, paralysis, reversal and an ongoing infusion can follow additional rules described on the card.
Shared mod icon. Read the card name and dose; the printed vial label belongs to norepinephrine.- Indications
- Local reversal of epinephrine or norepinephrine extravasation.
- Contraindications
- Does not treat calcium, hyperosmolar or other irritant leaks. Systemic injection does not replace local infiltration at the injury.
- Route
- Local infiltration at the affected body part.
- Dose
- 5 mg full reference infiltration (1 mL). Smaller infiltrations can add within the 90-second treatment window.
- Onset
- Matching local recovery support begins when infiltration completes; tissue injury resolves gradually.
- Peak effect
- Local recovery treatment; no fixed systemic peak.
- Side effects
- Local action has no systemic medication effect. A prepared syringe delivered systemically can instead cause vasodilation, hypotension and a modest heart rate increase.
- Special considerations
- Treat the leaking line and use the matching local action. One infiltration targets one exposure, prioritizing the most severe injury.
- Medication interactions
- Treats local epinephrine/norepinephrine injury. Systemic phentolamine can oppose pressure support. Hyaluronidase treats the other listed irritant leaks.
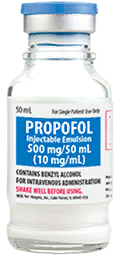
- Indications
- Sedation/hypnosis for procedures and maintenance of sedation during ventilation.
- Contraindications
- No analgesia by itself. Use cautiously with low pressure, poor ventilation or other sedatives.
- Route
permitted in prepared saline infusions.
- Dose
- Reference: 100 mg for the 83 kg reference patient, scaling with body weight. Stock concentration: 10 mg/mL.
- Onset
- Effect builds after delivery and peaks at 90 seconds. Induction depends on the total current hypnotic effect.
- Peak effect
- IV1 min 30 s
- IO1 min 30 s
- Side effects
- Respiratory depression and hypotension, more pronounced with depleted physiological reserve.
- Special considerations
- Provide analgesia separately when needed. Continue ventilation and pressure monitoring. Ketamine: maintenance threshold also affects the shared sedation maintenance requirement.
- Medication interactions
- Midazolam increases hypnosis and adds respiratory/pressure depression. Opioids augment hypnosis and respiratory depression. Ketamine contributes to the combined hypnotic load. Rocuronium provides no extra sedation.
| Route | 10% onset marker | Peak effect | Full effect hold | Effect ends |
|---|---|---|---|---|
| 5.8 s | 1 min 30 s | 3 min | 8 min |
Propofol IV / IO effect graph
The percentage shows this route’s relative medication effect for one delivered dose. The 10% marker is a comparison point, not a guaranteed symptom onset. Sedation, paralysis, reversal and an ongoing infusion can follow additional rules described on the card.
- Indications
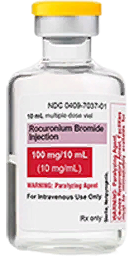
- Neuromuscular blockade for intubation or other procedures requiring paralysis.
- Contraindications
- Do not use without adequate sedation and a way to ventilate the patient. It has no analgesic, sedative or amnestic effect.
- Route
- Dose
- 1 mg/kg reference dose (83 mg at 83 kg). The default paralysis threshold is 0.5 active reference equivalents, so amount delivered and time since delivery both matter.
- Onset
- Paralysis begins when active effect crosses Rocuronium: paralysis threshold. For a fully delivered 1 mg/kg reference dose at the default threshold, this is about 20 seconds; reference peak is 60 seconds.
- Peak effect
- IV1 min
- IO1 min
- Side effects
- Apnea and inability to move. Inadequate sedation during paralysis causes physiological distress with rising rate and pressure.
- Special considerations
- Rocuronium: paralysis threshold is under ACM Extended: Airway. The exposed Rocuronium: onset (seconds) slider currently does not add a second delay; native absorption timing controls onset. Detailed effects remain active in ACE basic medication mode.
- Medication interactions
- Sugammadex binds and reverses the available rocuronium dose. Ketamine, propofol and midazolam supply sedation; opioids provide analgesia/adjunct effects. Naloxone does not reverse paralysis.
| Route | 10% onset marker | Peak effect | Full effect hold | Effect ends |
|---|---|---|---|---|
| 3.9 s | 1 min | 30 min | 40 min |
Rocuronium IV / IO effect graph
The percentage shows this route’s relative medication effect for one delivered dose. The 10% marker is a comparison point, not a guaranteed symptom onset. Sedation, paralysis, reversal and an ongoing infusion can follow additional rules described on the card.
- Indications
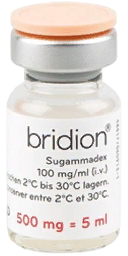
- Reversal of rocuronium induced neuromuscular blockade.
- Contraindications
- Does not reverse opioids or sedatives, and does not independently restore consciousness if another condition keeps the patient unconscious.
- Route
- Dose
- 100 mg is the medication reference unit, not a full reversal dose. The game's binding calibration is 16 mg/kg sugammadex for up to 1.2 mg/kg available rocuronium at full effect; smaller amounts give proportionate capacity.
- Onset
- Binding increases as the dose takes effect, with a reference peak at 150 seconds. Partial reversal can occur before the peak.
- Peak effect
- IV2 min 30 s
- IO2 min 30 s
- Side effects
- No direct heart rate, breathing rate or analgesic effect is modeled for this medication itself.
- Special considerations
- Stock vial contains 500 mg. Reversal is tied to actual rocuronium doses and available binding capacity; it does not grant permanent protection against future paralysis.
- Medication interactions
- Specifically reverses rocuronium. Other sedatives can remain active after movement and spontaneous breathing recover.
| Route | 10% onset marker | Peak effect | Full effect hold | Effect ends |
|---|---|---|---|---|
| 9.7 s | 2 min 30 s | 25 min | 35 min |
Sugammadex IV / IO effect graph
The percentage shows this route’s relative medication effect for one delivered dose. The 10% marker is a comparison point, not a guaranteed symptom onset. Sedation, paralysis, reversal and an ongoing infusion can follow additional rules described on the card.
- Indications
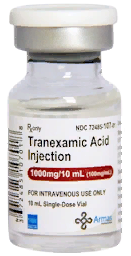
- Support of clot stability and modeled external/internal bleeding control.
- Contraindications
- Does not mechanically close a wound, replace circulating volume or substitute for hemorrhage control. No additional TXA specific contraindication is enforced in the reviewed medication path.
- Route
permitted in prepared saline infusions.
- Dose
- 1 g reference dose (10 mL of 100 mg/mL).
- Onset
- Coagulation handling starts with administration; the reference medication effect peaks at 15 seconds. Bleeding response depends on the wound and clotting state.
- Peak effect
- IV15 s
- IO15 s
- Side effects
- No separate TXA specific adverse syndrome is implemented in the reviewed medication path.
- Special considerations
- Continue pressure, dressings, packing and volume resuscitation as indicated by the patient's injuries.
- Medication interactions
- Calcium and clotting factors affect the wider coagulation model. TXA does not replace either. No dedicated harmful drug pair interaction is modeled.
| Route | 10% onset marker | Peak effect | Full effect hold | Effect ends |
|---|---|---|---|---|
| 0.97 s | 15 s | 10 min | 15 min |
Tranexamic acid (TXA) IV / IO effect graph
The percentage shows this route’s relative medication effect for one delivered dose. The 10% marker is a comparison point, not a guaranteed symptom onset. Sedation, paralysis, reversal and an ongoing infusion can follow additional rules described on the card.
Delivery and addon options
| Location in Addon Options | Option | Effect |
|---|---|---|
ACM Extended: Systems > Hardcore | Enables rate-sensitive manual IV / IO pushes, incremental Stop Push and the corner syringe display. See push times and on/off behavior. | |
ACM Extended: Circulation > Medications | Require saline flush after push | When enabled, adenosine, amiodarone, calcium chloride, calcium gluconate and epinephrine pushes wait for the required saline flush. |
ACM Extended: Infusion & IV > Required Training | Patient Narc Box: Required Training | Minimum training for the patient Draw Medication action. Default: Medic. Self preparation retains its own permissions. |
ACM Extended: Circulation > Procedures | Allow Push Dose Epinephrine Action | Shows the dedicated measured push dose action. |
ACM Extended: Circulation > Required Training | Dedicated Bolus Actions: Required Training | Controls the dedicated epinephrine and osmotherapy bolus actions. Default: Medic. |
ACM Extended: Neuro & TBI > Procedures | Allow Osmotherapy Bolus Actions | Enables the dedicated 23.4% hypertonic saline and mannitol push actions. |
ACM Extended: Airway > Ketamine sedation | Ketamine: induction threshold / Ketamine: maintenance threshold | Changes the shared hypnosis thresholds. The default induction setting is 7 and maintenance is 1.2. |
ACM Extended: Airway > Rocuronium paralysis | Rocuronium: paralysis threshold | Changes the active dose needed for paralysis. Default: 0.5. |
ACM Extended: Systems > Systems | Extravasation / vesicant injury | Enables tissue injury from drug leakage and the matching local antidote treatments. |
Prepared saline infusions accept amiodarone, epinephrine, norepinephrine, lidocaine, ketamine, TXA, fentanyl, morphine, midazolam, ondansetron, calcium chloride, calcium gluconate, ceftriaxone and propofol. Esmolol and magnesium have separate premixed bags. See IV access and infusion setup for line checks and the drip calculator.
Ketamine, rocuronium and sugammadex retain their detailed effects even when ACE uses basic medication behavior. The other timing cards describe the advanced medication path. A drawn syringe or an attached bag is not proof that its full contents have reached the patient.
Other osmotherapy presentations
| Product / action | Dose and response | Timing and limitations |
|---|---|---|
Hypertonic Saline 23.4% (30mL) > Push 23.4% Hypertonic Saline | One 30 mL bullet. The current action produces about a 0.96 mmHg ICP reduction and a 0.36 mEq/L sodium rise before limits. It does not scale the effect up for the 23.4% concentration. | Applied at completion of the 6-second action. Requires modeled TBI and sodium below Sodium ceiling (mEq/L). The inventory label prefers central access, but this dedicated action does not require a separate central line placement. |
Mannitol 20% (50g Push) > Push Mannitol 20% | One push item. The current action produces about a 0.8 mmHg ICP reduction before limits and no sodium increase. | Applied at completion of the inherited 6-second action. Shares the sodium ceiling check. The push currently does not directly remove circulating volume. |
These are the current in game action results. The larger bag references on the cards describe full infusion delivery and must not be used to predict the dedicated push response.
Interaction quick reference
| Combination | What to watch |
|---|---|
Opioid + propofol or midazolam | Greater respiratory depression, reduced CO2 response, hypotension and deeper hypnosis. |
Opioid + ketamine | Additional respiratory depression and increased combined hypnosis; smaller respiratory interaction than opioid plus propofol/midazolam. |
Propofol + midazolam | Increased hypnosis with added respiratory and pressure depression. |
Ketamine + midazolam | Additional respiratory depression and combined sedation. |
Amiodarone + esmolol | Further slowing of heart rate and lower pressure. |
Lidocaine + esmolol / shock | Reduced lidocaine clearance and greater toxic accumulation. |
Calcium chloride + calcium gluconate | Combined elemental calcium burden. Compare elemental amounts and total delivery rate. |
Naloxone + opioids | Reversal of opioid effects and the opioid overdose syndrome; other sedatives remain active. |
Sugammadex + rocuronium | Dose limited binding and reversal. Other reasons for unconsciousness remain. |
Ondansetron + nausea producing medications | Less nausea, without reversal of the other drug's effects. |
Sources and revision
Reviewed against the current ACM Extended source on 13 September 2026.
Sources and revision
Vial images are the mod’s own inventory artwork. See the IV catheter slideshow for placement controls. Artwork and controls were checked at ACM Extended revision abf6253. Medication behavior retains the source revisions listed on this page.